F1 Data Analysis Suite
Telemetry, G-force and aerodynamics analysis over 1M+ real Formula 1 data points
Visit the live site →Role: Solo — data engineering, analysis, visualization, site build
The problem
Formula 1 publishes an enormous amount of raw telemetry, but almost nobody turns it into something you can actually read: what does 5G braking look like on a track map, how does downforce trade against drag corner by corner, why does a one-stop beat a two-stop at Monza. I built a full analysis pipeline to answer those questions from real race data — and then made the answers visual enough that a non-engineer can follow them.
How I built it
Built on real telemetry, not estimates
Every chart is driven by actual session data pulled through the FastF1 API — over a million data points across Monaco, Spa and Monza, covering 20 drivers. Speed traces, throttle and brake application, gear shifts, all from the cars themselves.
Computed the physics layer
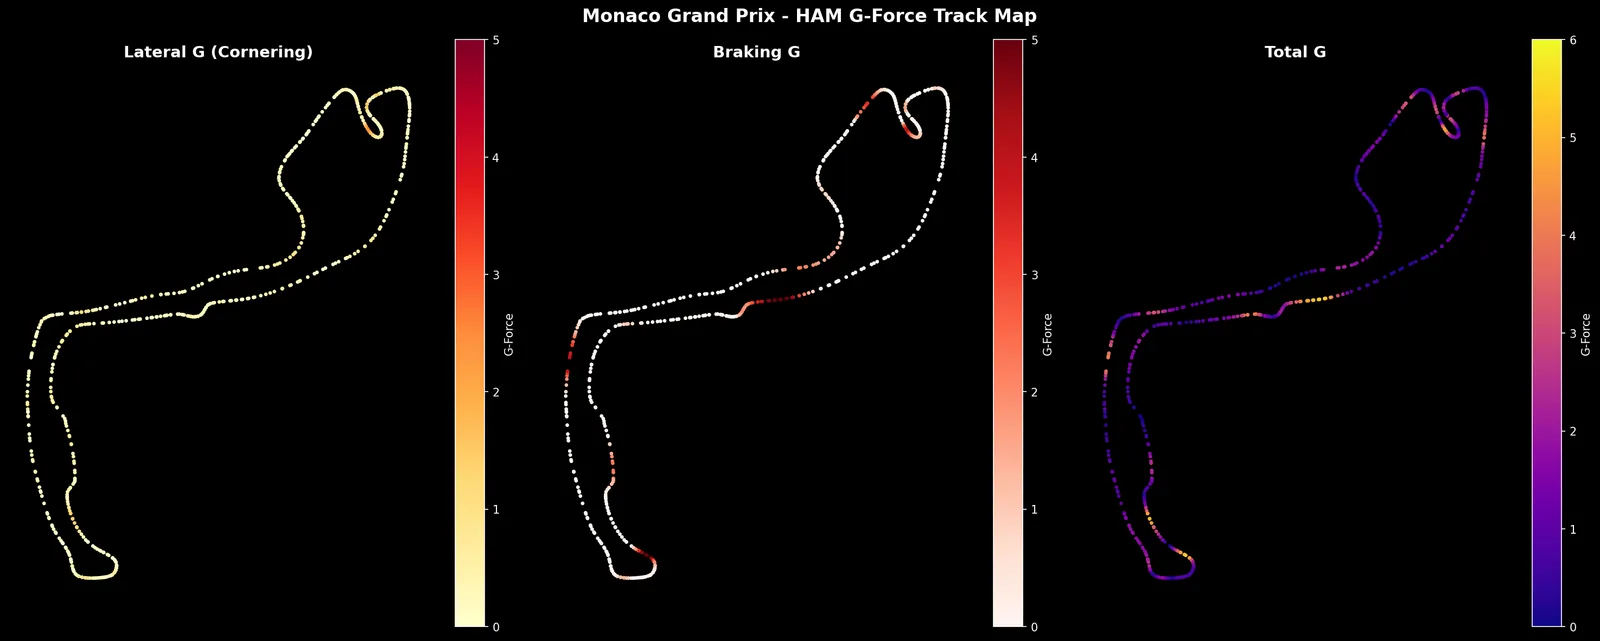
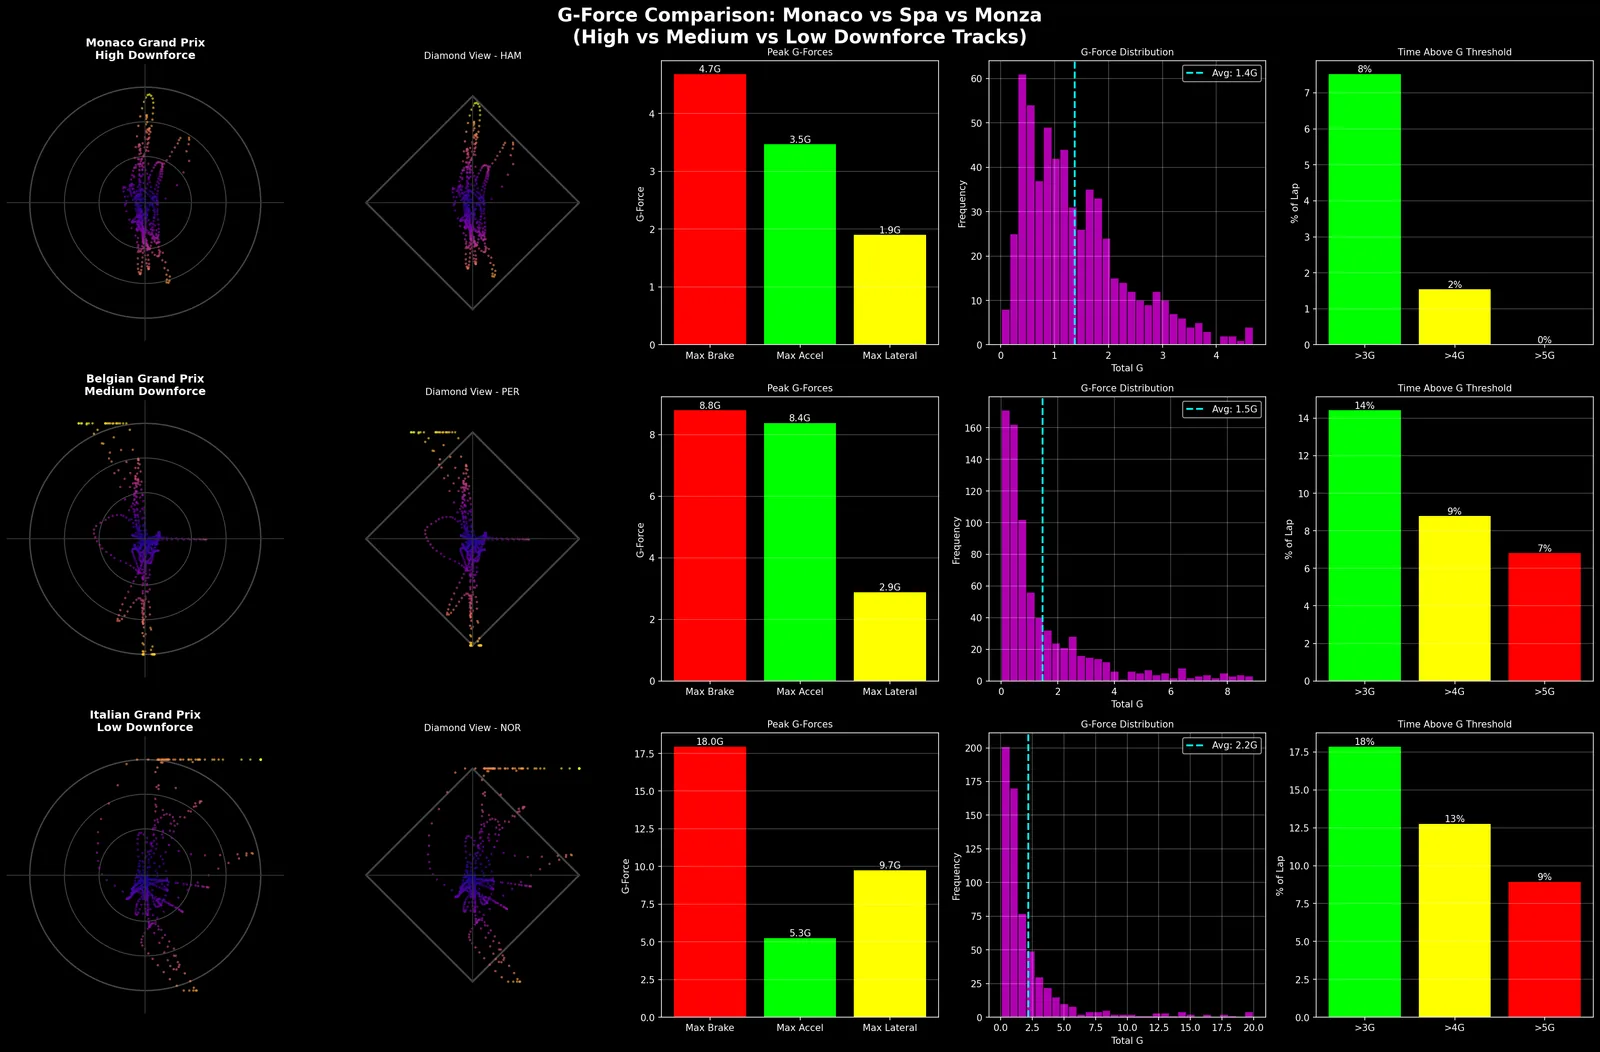
G-force decomposition (braking, acceleration, lateral) calculated from position and velocity data, validated against the known limits of the cars — and mapped point-by-point onto the actual track geometry so you can see where the forces happen.
Modeled the aerodynamics
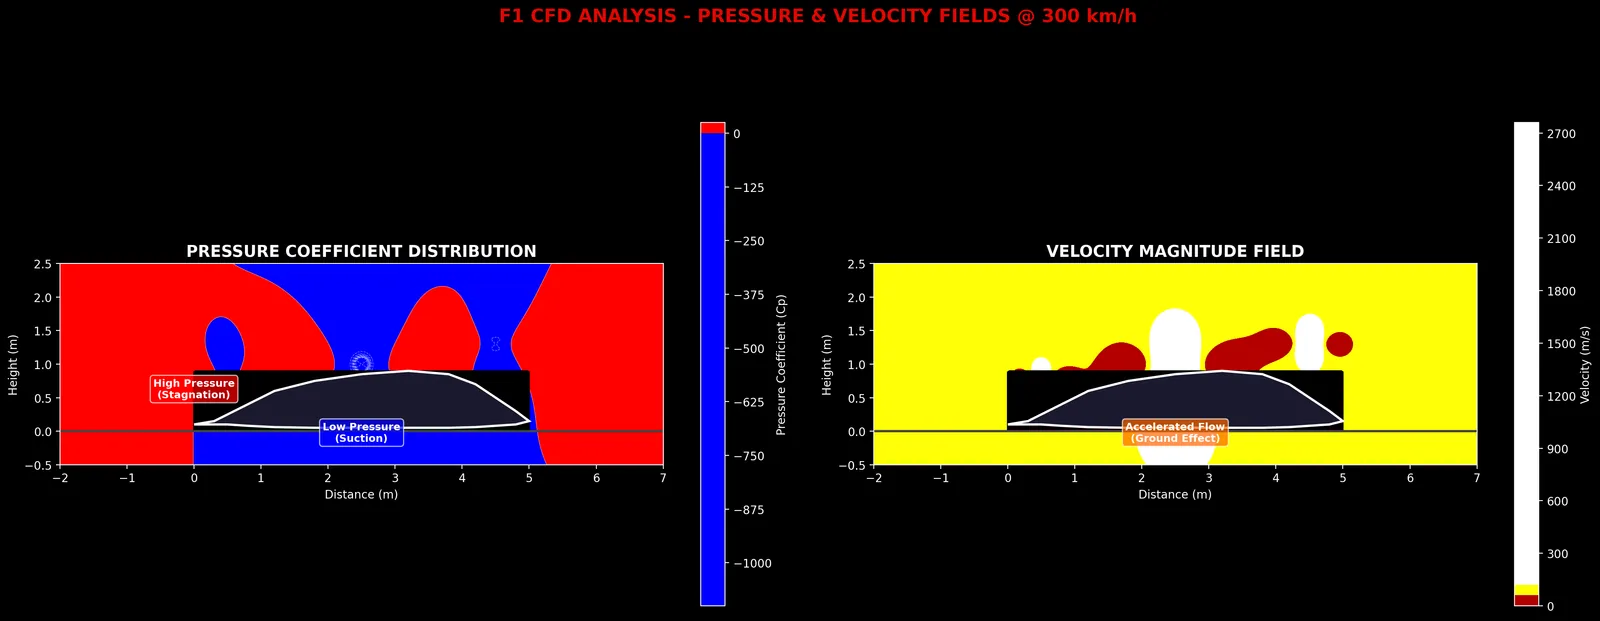
CFD-based downforce and drag modeling using open PERRINN F1 coefficients, with pressure and velocity field visualizations — the same style of analysis teams use, built entirely on open tools.
Made it explorable
The whole suite is published as an interactive site: telemetry, G-force, aerodynamics, strategy and power unit sections, each with its own visual gallery. The analysis is only useful if someone can navigate it.
The outcome
50+ visualizations generated from 12 analysis scripts, covering three circuits with fundamentally different characters — Monaco's maximum-downforce street circuit, Spa's balance, Monza's low-drag speed. The pipeline is re-runnable against any race weekend the API covers.
This is the same job as client work in a different costume: take a mass of raw data nobody can read, decide what actually matters, and build the thing that makes it obvious. The domain changes; the discipline doesn't.
Technical stack and details
A Python analysis suite processing real Formula 1 telemetry through the FastF1 API: G-force mapping up to 6G, CFD-based aerodynamic modeling using PERRINN coefficients, tire strategy and power unit analysis across Monaco, Spa and Monza — published as an interactive site with 50+ visualizations.
Want something built to this standard?
Tell me what you are trying to do and I will tell you honestly whether I am the right person for it — and roughly what it costs. Replies within one business day.